3.12 Analysis of a Table of Means
In this section, we consider the table of individual consumption, regarding consumption of food, observed in 2000 persons. We also have available information for sociodemographic characteristics of each person. The PCA outputs are similar to those displayed in figure 3.11.
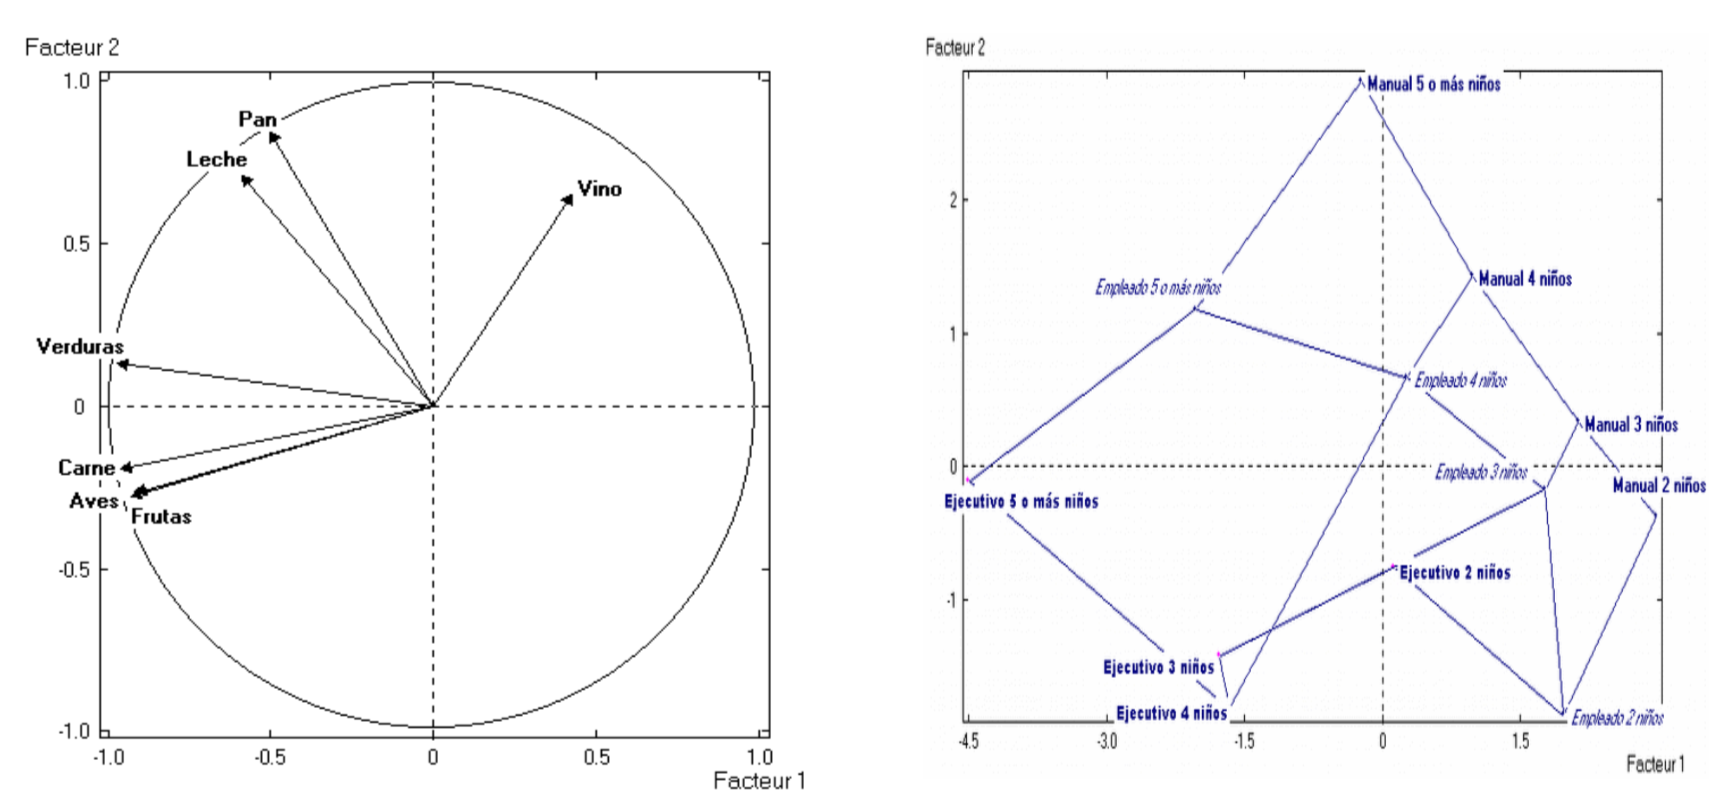
Figure 3.11: Analysis of a table of means.
The first graph has to do with the points “consumption variables” (how much it was spend on 7 products); the second graph has to do with the centroids of categories for variable “number of children” crossed with “socio-economic category” with 3 values (worker, employee, and executive).
We have retained the output from crossing these two nominal variables because the dispersion of their categories covers all regions of the factorial plane. Each point is the centroid of the individuals that have one of the categories of “number of children” crossed with one of the categories of “socio-economic category”. With this, we can try to imagine the constellation of points around each centroid.
In circumstances like this, we could obtain analogous graphical representations by performing PCA on the table formed by the same 7 columns, but with only 9 rows. The rows corresponding to the categories obtained from crossing the aforementioned nominal variables. The analysis of this table with the mean consumption per category, gives the plots shown in 3.11.
Inspecting the output, we get information about a global model of the consumption structure, by using only those two factors.
Notice that the inverse process, does not imply the same conclusions. If we begin with the analysis of tables of means, we obtain the plane that best differentiates the row categories, while exploring the association among consumption from the perspective of such categories. This analysis can be quite different from the individual data if the categories under study do not get to “cover” all of the factorial plane.