3.11 Comparing Various Tables
Consider a study in which we observe a group of individuals measured by a set of variables. Moreover, suppose that we repeat the study at different time periods, and that we are interested in looking at the evolution of such measurements over time. A study like this will provide several data tables of the same dimension (e.g. one table per time period). Obviously, one of the analytical goals has to do with comparing such tables.
One possible way to compare the tables is to take one of the data tables as the active variables, while the rest of tables are treated as supplementary variables. For example, we can take the first table as the reference table; or also the last table. Likewise, we can take the mean table and use it as a benchmark to compare all the tables against with: the mean table is the active one, and all the other tables become supplementary.
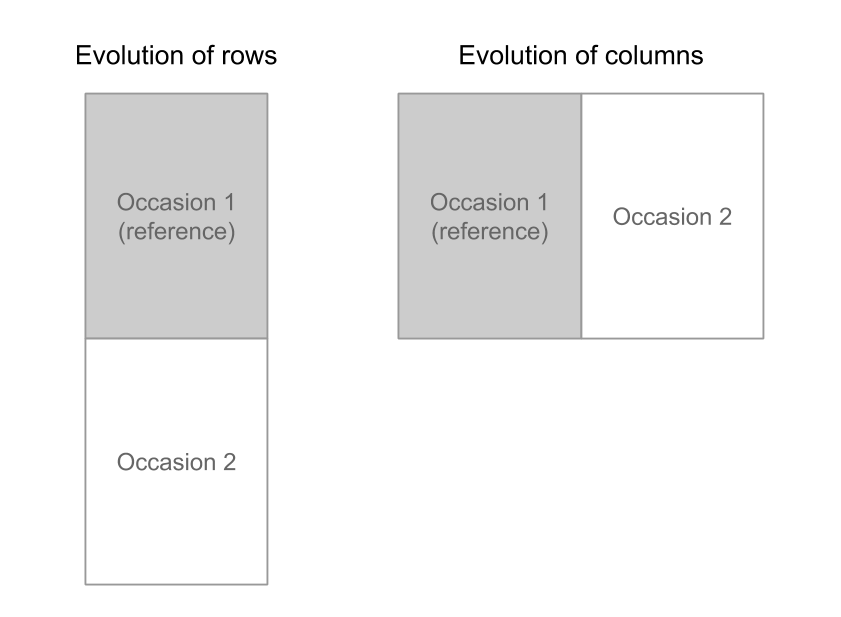
Figure 3.9: Comparison of two tables.
In the example of the international cities, we have the same study performed at two points in time: 1991 and 1994. So far we have used only the 1994 table. However, we can use the table from 1991. The only difference is that some cities are not included in 1991: Manama, Prague, Budapest, Abu Dhabi, and Bangkok.
We have decided to consolidate both tables into a single one: by stacking both tables by columns. Doing this allows us to consider those cities from 1991 as supplemetary individuals, and then project them on the results from the analysis of the 1994 table.
The axes of this analysis are those defined in the analysis of the 1994 table. The first axis is related with the income inequality. In turn, the second axis is related with the opposition of the salaries of qualified manual labor, versus the salaries of managers and employees in the sector of services.
In this plane we project the the cities in terms of their salaries from 1991. Then, the movement of the cities towards the left side suggests a greater salary equality; conversely, the those cities moving upward, suggest an increment of salaries in manual labor jobs. Interestingly, notice the substantial changes in cities such as Lagos and Yakarta between 1991 and 1994, indicating a unstable pattern of salaries in those cities.
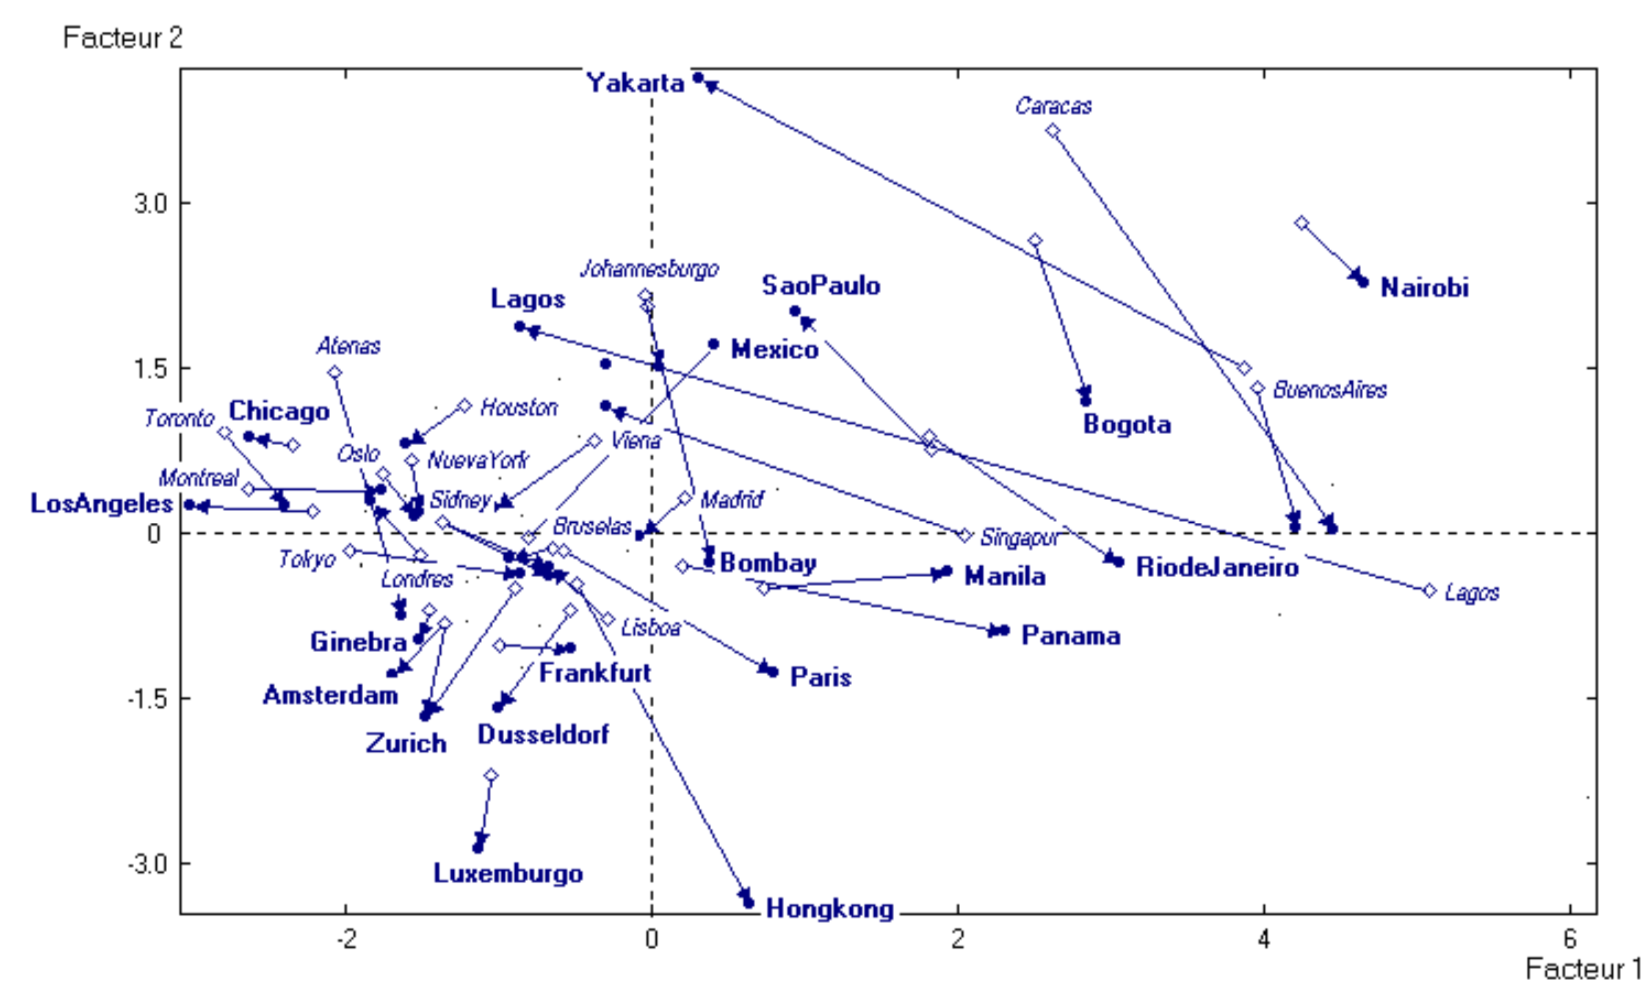
Figure 3.10: Some trajectories of cities between 1991 (in italics) and 1994 (in bold).
Note: There are other multivariate techniques that can be applied to compare several tables. Some of the common methods derived from PCA are STATIS (Lavit, 1998), and AFM (Escofier-Pagès, 1990).